Data Visualisation and Cartography (DVAC)
Description
This 1-week online course will provide the participants with the background knowledge and
necessary skills to create effective visual representation of data in the form of maps. Basic
understanding of Geographic Information System (GIS), various types of maps, map elements, and
ways to convert different kinds of data into 2-D and 3-D visual representations will be covered. We
will be using open source and freely available software tools in this course including QGIS, Google
Earth Pro, and StoryMaps. Previous knowledge of GIS is not required, though familiarity with
computers is necessary. Satisfactory completion of all assigned readings, reflections, and quizzes as
well as participation in discussions and peer-evaluation assignments are required to receive the
certificate of completion.
After completing this course, participants will be able to:
- Apply cartographic principles in making maps with appropriate symbols and colors
- Create and evaluate professional quality maps
- Create custom maps and 3D visuals to meet specific needs
- Interpret map results and make sense of the trends in data
- Communicate project outcomes more effectively with interactive maps using StoryMaps
Enrollment Instructions
- Click on the link below to go to the ADDA moodle website.
https://adda.outreach.vt.edu/course/index.php?categoryid=1
- Follow the directions to make a Moodle account, or login if you already have one.
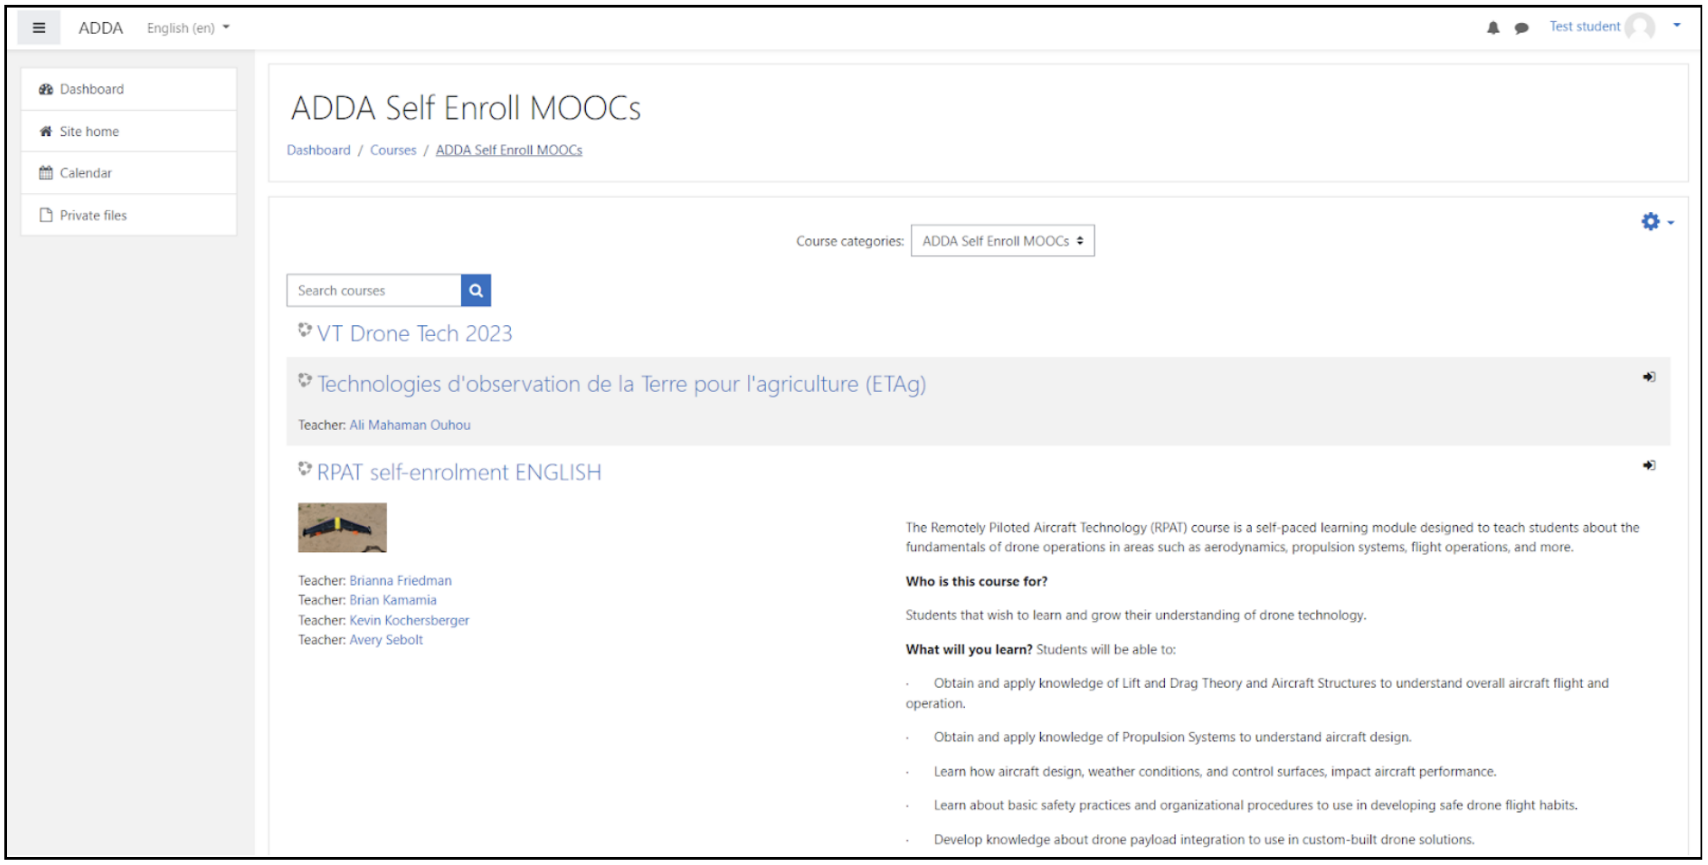
- After logging in you should see this page.

- Scroll on the page and click on the course you want to enroll in. .
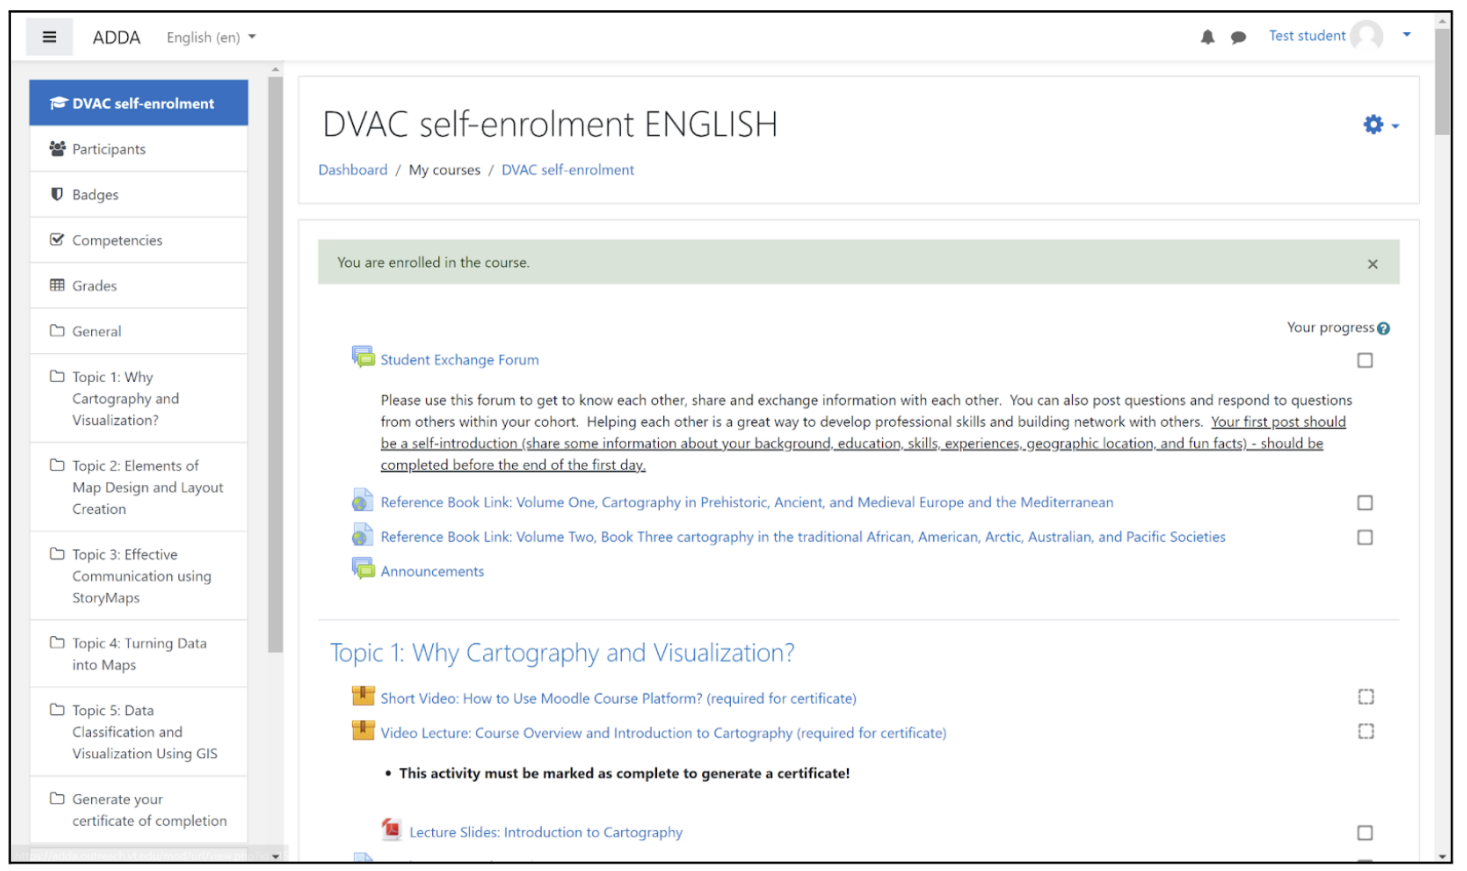
- Scroll down to the bottom of the course page and click on the button Enrol Me.

- You should now see this page, and are free to begin the course. Please remember that you have 3 weeks to complete the course before your enrollment expires.

Thank you for joining us and good luck!


